Settings & privacy
How to configure first-party GA4 collectors and pinned parameters
Configure page observations, exact GA4 collector endpoints, and frequently checked property names.
Open Settings → Capture. Choose Save settings after changing page observations, collector URLs, or pinned parameter names. Changing tabs inside Settings keeps your draft; closing without saving does not apply those recording preferences.
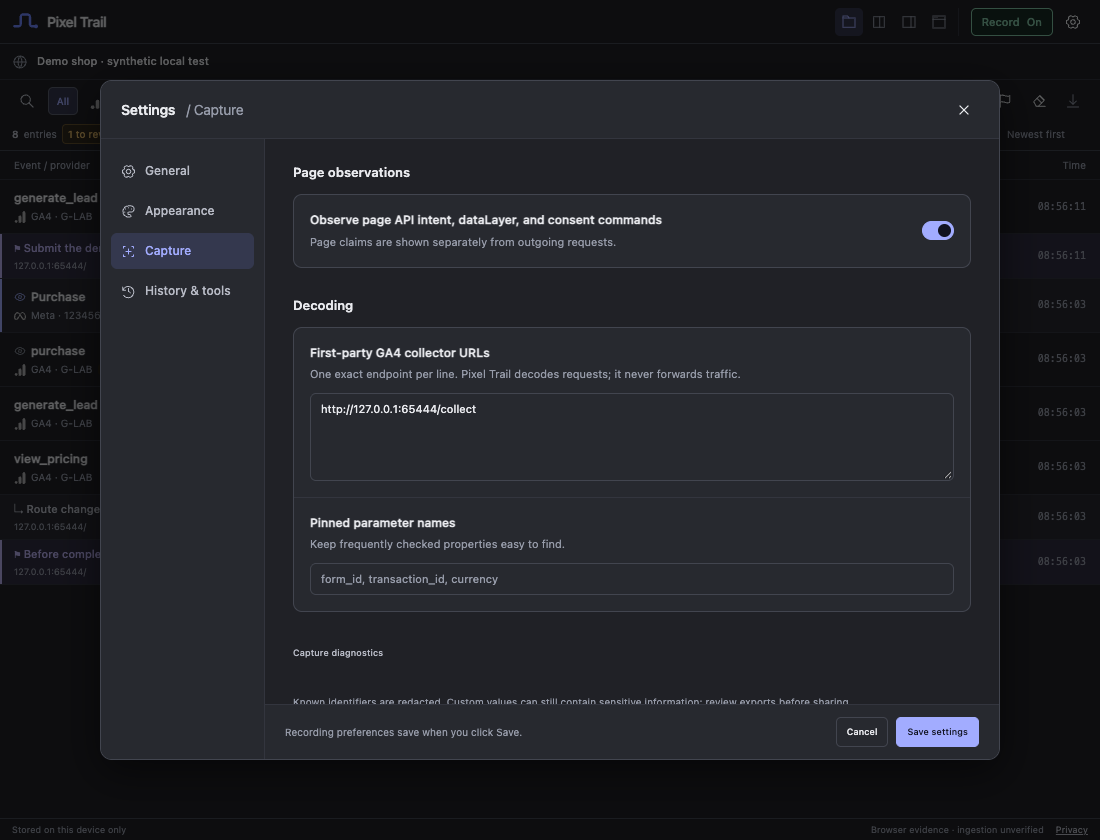 Actual extension interface with synthetic test data.
Observe page calls separately from requests
Observe page API intent, dataLayer, and consent commands enables supported page observations. This is on by default. These entries are labeled separately from network events because a page calling an API does not prove that a request left the browser.
Turning it off disables those observations while permitted network inspection can continue. A reload may be useful when you want to observe the page’s initial calls after enabling capture.
Decode an exact first-party GA4 endpoint
If your GA4 browser requests use a first-party collection URL, add it under First-party GA4 collector URLs, one endpoint per line:
https://metrics.example.com/g/collect
Use the exact origin and path. Pixel Trail compares both; this is not a domain-wide wildcard. Do not enter credentials, a query string, or a fragment. Up to ten mappings are retained.
This tells Pixel Trail to apply its GA4 decoder to requests at that endpoint. It does not install analytics, redirect traffic, create a collector, or forward requests. Adding an arbitrary URL will not make a non-GA4 payload readable. Browser website permissions still apply.
Keep a property near the top
Enter comma-separated Pinned parameter names, such as:
form_id, transaction_id, currency
Up to ten names are saved. A matching exact key appears first, marked with a star, in the event’s decoded Event properties. Names are case-sensitive. Pinning is a display preference: it does not add a property to an event, change collection, or require that parameter in a QA test.
Check capture health
Expand Capture diagnostics to see available website permission, request-body capture, and page-observer information. Diagnostics describe visibility; a quiet timeline alone cannot establish that no event was attempted.
Still need help? Contact support.