Tag Assistant won't connect? Check the GA4 request directly.
Check whether a GA4 event left your browser while Tag Assistant will not connect, and know when you still need Preview or DebugView.
A failed Tag Assistant connection does not tell you whether your GA4 event was sent. Check the browser request for the action you are testing, then use Tag Assistant for tag logic and GA4 DebugView for debug-enabled receipt.
Start with the request if that is the question blocking you. Keep Tag Assistant for the container logic and unpublished changes you still need to test.
Decide which question you need answered
These are three different checks:
| Your question | Where to check |
|---|---|
| Did my container's tag run, and in what order? | GTM Preview and Tag Assistant |
| Did this browser send the expected request to the expected destination? | Pixel Trail or the browser's Network panel |
| Did the debug-enabled event appear in my GA4 property? | GA4 DebugView |
Google's preview documentation describes Preview as a way to test a container draft before publishing. Keep that job separate from inspecting outgoing traffic. Pixel Trail is useful for the second row; it does not reproduce Google's container debugger or read your GA4 property's stored events.
Start with one expectation: “Submitting the demo request should send generate_lead to our test measurement ID, with the form's identifier.” That gives you an event, a destination and a value to check.
Try a focused connection check
Use Google's connection troubleshooting to check the part that matches your symptom:
- The starting page: connect to the exact URL where the Google tag should load. A different page on the same website may have a different setup.
- Late loading: Google recommends Retry when the tag script loads after Tag Assistant tries to connect.
- A page that breaks with the debug URL: try deselecting Include debug signal in the URL when connecting. Google documents cases where the added parameter interferes with page behavior.
- An extension, redirect or consent difference: change one test condition at a time. Check Tag Assistant's website access too. Changing several conditions at once leaves you with a connection and no explanation.
A debugger timeout is not evidence that your form tag needs another trigger. Finish the connection checks before changing tag logic to compensate for it.
Watch one action in Pixel Trail
Open the page you want to test, then start recording that website in Pixel Trail. Check History for and Record before doing the action. Recording starts when you open the inspector by default, but it cannot recover requests from before capture began.
Reload if you need the page's startup activity. Filter to GA4, add a Mark here checkpoint named “Before demo request,” then submit the form once.
Open the resulting event and inspect its properties. Check five things together:
- The event name matches your expectation, such as
generate_lead. - The destination measurement ID belongs to the environment you intended to test.
- The timestamp puts it after your checkpoint.
- The expected form or business parameters have the intended values.
- The row describes a network request and shows its transport outcome, rather than only a detected tag or page/API observation.
The screenshot below shows a controlled example: one generate_lead request after a checkpoint, sent to a local GA4-format collector. Its decoded form_id is demo-contact, and the collector returned HTTP 204. No Tag Assistant connection was needed for this capture.
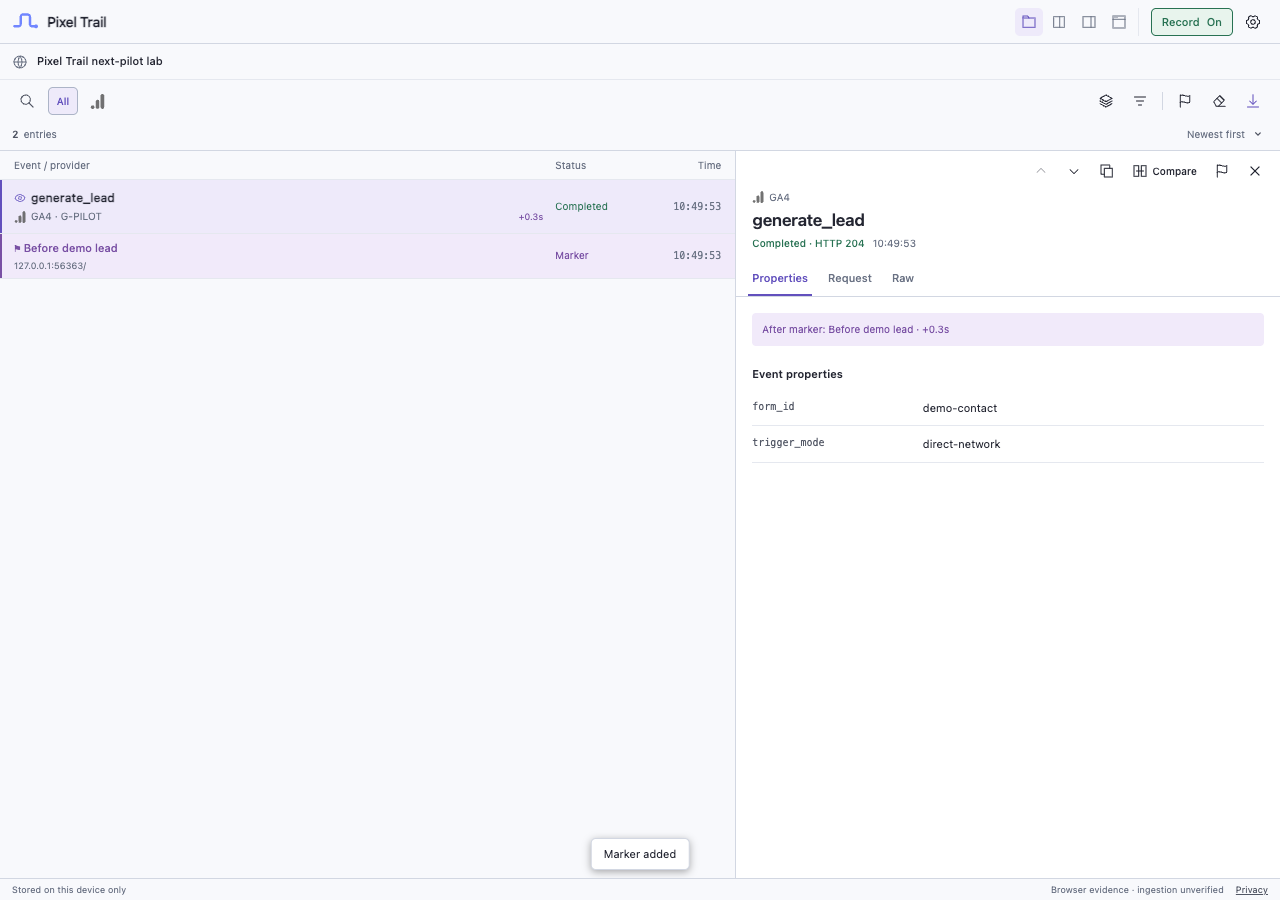
A data-layer event or a loaded Google tag does not, on its own, establish that this particular action produced a GA4 request.
You can perform the transport check without installing another extension: use Chrome DevTools' Network panel, preserve the log if the action navigates, and inspect the matching request and its payload. Pixel Trail provides the provider filter, decoded fields and checkpoint alongside that evidence.
Read the outcome without guessing
| What you observe | What to investigate next |
|---|---|
| Expected request, correct destination, completed response | Check debug-enabled receipt in GA4 next. The Tag Assistant connection can be investigated separately. |
| Event exists, destination or parameters are wrong | Investigate the tag configuration and values for this environment. |
| Page/API intent appears, but no matching request is captured | Follow the path between the command and transport. First rule out capture permissions, filters and endpoint recognition. |
| Nothing relevant appears | Confirm the selected website and recording state, reload, and reproduce. An empty capture is not proof that nothing was attempted. |
Pixel Trail recognizes supported GA4 request formats. If your setup uses a first-party collector, it may need an explicit endpoint mapping in Settings. The missing-events guide covers those capture checks.
A Completed row is browser transport evidence. It does not establish that GA4 processed the event, included it in reports or attributed it correctly.
Keep unpublished changes separate
If the fix exists only in your GTM workspace, visiting the ordinary website does not, by itself, activate that draft. Preview is what lets you test the unpublished container configuration.
That distinction matters when the production tag is broken and the draft is correct. Capturing the production request again can confirm what is deployed, but it cannot validate an unpublished fix that never ran. Restore Preview, or use an explicitly configured test environment, before judging that fix.
Check GA4 after checking the request
For the receipt check, enable debug mode and select your device in DebugView. An ordinary event request does not automatically make it a debug event. Google also documents privacy controls and denied Analytics consent as reasons events can be absent from DebugView.
Keep the event name, destination, relevant parameters, checkpoint time and observed outcome. Those details tell the next person whether to investigate trigger logic, outgoing traffic or GA4 visibility.
Sources and evidence
- Google: Troubleshoot with Tag Assistant
- Google: Preview and debug containers
- Google: Monitor events in DebugView
- Chrome DevTools: Preserve requests across page loads
Written with AI assistance. The screenshot comes from a controlled local-collector test. Tag Assistant connectivity and GA4 ingestion were not tested.